close
closeEvents & Promotions
| Last visit was: 30 Apr 2024, 16:11 |
It is currently 30 Apr 2024, 16:11 |

Customized
for You
Track
Your Progress
Practice
Pays

08:30 AM PDT
-09:30 AM PDT

12:00 PM EDT
-01:00 PM EDT

01:00 PM EDT
-11:59 PM EDT
08:30 AM PDT
-09:30 AM PDT
06:45 AM PDT
-12:00 PM PDT
11:00 AM IST
-01:00 PM IST

05:30 AM PDT
-07:30 AM PDT
11:00 AM IST
-01:00 PM IST

08:00 PM PDT
-09:00 PM PDT
| FROM Magoosh Blog: The Best GMAT Prep Courses: 2023 Edition with Comparison Charts |
 Choosing the best GMAT prep course, like choosing a business school, is all about what works best for you as an individual. There is no objectively ‘best’ course that is right for everyone, but there are six GMAT courses that should be on your radar in deciding which option suits your needs. One way to choose a course is to attend a free session or engage with some free material to see what suits you best. To make your decision, you’ll have to consider your learning style, and which course elements—from price to score guarantees—matter most to you. Don’t worry. We’ve done the hard work for you and have broken down the pros and cons of what we consider the six best GMAT online prep courses. Magoosh $249 (get 10% off here!)$110 per hourUp to 70 point score improvement guarantee1,300+ practice questions and two practice tests. Subscribers get a 40% discount on GMAT  Official Practice Exams One-year access Princeton Review$799$167 an hour 620+ starting score required to be eligible for the guarantee of a 700+ score3,000+ practice problems and 10 practice tests Four-month access Target Test Prep$149 per month to $499 for 6 months access$350 per hourUp to 110 points depending on the starting score4,000+ practice questionsOne-month to four-month access Manhattan Prep (powered by Kaplan)$999$225 per hourN/A1,100+ questions and six practice tests Six-month access PrepScholar$2594 hours of tutoring from $799 60+ score guarantee Access to 1,000+ questions and 4 practice tests One-month to four-month access e-GMAT$199-399N/AN/A4,500+ questions and five practice testsTwo-month to six-month access Magoosh is consistently ranked among the best GMAT prep courses. And that is not just due to the low price, but to the quality of content, which is on par with competitors. While the cost of Magoosh courses is much lower, you are getting all the content and support you need to ace the test, with one of the best GMAT online prep courses available. Pros:
Want to give Magoosh a try? Use this coupon to get 10% off Magoosh GMAT premium!   Princeton Review is a go-to comprehensive course with great question explanations and quality content. They offer solid, tried, and tested courses. The fact that this course includes expert feedback on your Analytical Writing Assignment essay means it is really a comprehensive solution. The self-paced offering starts at $699 and includes a one-on-one session with a GMAT expert. Pros:
Target Test Prep focused on Quant only and built up a reputation as an excellent Quant course. Now, there is a verbal component added at no extra cost. The price differential between offerings applies to the length of access to the course, so you can access the same extensive content for $149 a month. Pros:
Manhattan Prep is known for its engaging videos and instructors. The materials are top-notch and the self-study GMAT guides frequently make the best GMAT books lists. Pros:
computer adaptive practice tests[/list] Review PrepScholar’s GMAT prep course is designed around personalization. Students take a diagnostic test upfront, and their proprietary algorithm works to create a custom study plan. You can also see which skills you have mastered and which you still need to work on on your student dashboard. Pros:
e-GMAT has a reputation for helping non-native English speakers improve their Verbal scores. Highly ranked and dedicated tutors are employed full-time. Pros:
Best GMAT Prep FAQ Are the more expensive GMAT prep courses worth the price? Show Answer That depends on what you are getting. Don’t make the mistake of thinking an expensive course is necessarily a better one. In general, expect to pay more for more one-on-one time with an instructor. Private tutoring can often be the best way to identify and address gaps in your knowledge. If you are unsure about which is the best GMAT online prep course for you, you can ask if they’ll allow you to sit in on a session before you make up your mind. What’s the difference between online and in-person GMAT prep courses? Show Answer While the content should be the same, in-person GMAT prep courses give you the chance to ask any questions you might have about the topics. In-person classes can also make you feel more accountable and can give you access to a group of peers all going through the same thing. The best GMAT online prep courses, on the other hand, will give you all the materials you need to work around your schedule timelines and ability level. Whether in-person or online classes are better for you, will depend on your learning style, schedule, and requirements. What are the best GMAT prep apps? Show Answer One of the few things you need to rote learn for the GMAT is idioms. Idioms are tested in an estimated 1 out of 5 Sentence Correction questions, so they are vital to know. This GMAT idioms flashcards app from Magoosh gives you all the most tested idioms specific to the GMAT, in an easy-to-learn flashcard format. Speaking of easy-to-learn flashcard formats, the Magoosh Math flashcards give you an overview of all the GMAT math rules. While math is very much about practice, these flashcards make the general rules that you’ll need for Data Sufficiency more explicit and easier to remember. If you are looking for a mental math workout before the test, look no further than the Math Tricks app and Calculator: The game app which allow you to practice the mental math tricks that can speed up your problem-solving in the GMAT. While these are not GMAT apps per se, they will help you to solve mental math problems more quickly and creatively. The Wiley Efficient Learning mobile app also needs a mention as a must-have GMAT app. It is essentially a more portable version of the Official Guide. It will give you access to the same Official Guide Questions in the book and online question bank, just on the go. What materials should I use in my GMAT prep? Show Answer You’ll want to get a copy of the GMAC Official guide so you can practice with real GMAT questions. But you’ll also need some guidance on how to answer the questions. For insights, tools, and strategies, you should get hold of some kind of GMAT prep books or courses. Don’t underestimate the usefulness of a GMAT study schedule. Learn how to build your own GMAT study schedule to keep yourself motivated and accountable. Remember the best GMAT prep materials are the ones that work best for you. Part of the emphasis on practice is to get a sense of what works for you. Everyone is slightly different in their approach so experiment while you are practicing to adapt generic strategies to your benefit. Whichever method of study you choose, try not to get too bogged down in the theory. Don’t learn the theory in isolation without considering how the GMAT tests different concepts. The GMAT is all about practice—and gaining as much insight into the test and the question types as you can from each question you practice. In your first phase of studying you might find it useful not to focus too heavily on timing. Rather, learn the concepts at your own pace. Once you have a good idea of how to answer questions you can introduce timing in the second phase. Lastly, you should have practiced a number of mock tests before you take the GMAT to get a feel of the test, build up stamina and see what checks and balances you can introduce to improve your score. These are our top picks for the best GMAT online prep courses! Like we mentioned earlier, the best GMAT prep course may vary greatly depending on your study style, strengths and weaknesses, and even your reason for taking the GMAT. Nevertheless, we hope this list can help you decide which prep course or study method works best for you. Good luck!  The post The Best GMAT Prep Courses: 2023 Edition with Comparison Charts appeared first on Magoosh Blog — GMAT® Exam. |
| FROM Magoosh Blog: GMAT Score Calculator (with GMAT Score Chart) |
 Need a GMAT score calculator or score charts to determine your potential GMAT score from a practice test? Are you looking to retake the GMAT and wondering what score to aspire to? This post will cover what you need to know with an interactive score calculator, GMAT score charts (with downloadable PDF), and a full breakdown of what it all means. GMAT Score Calculator (Interactive)[/b] [*]GMAT Score Chart [*]How to Use the GMAT Calculator and Score Chart and to Improve Your Score[/list] practice test at home? How can you calculate your test score? Magoosh has the only GMAT score calculator you need! First, enter your Verbal and Quant scores in the calculator. Then, read on for more about how the GMAT exam scoring system works, what your quant score and verbal score mean, how business schools use the GMAT test, and more! your score may vary depending on which GMAT (or GMAT practice test) you take. It may even vary for the same raw score on the same test! This is because the difficulty level of questions you get right or wrong may change, even if the overall number doesn’t. Remember, the GMAT is computer-adaptive. free GMAT Score Charts PDF! 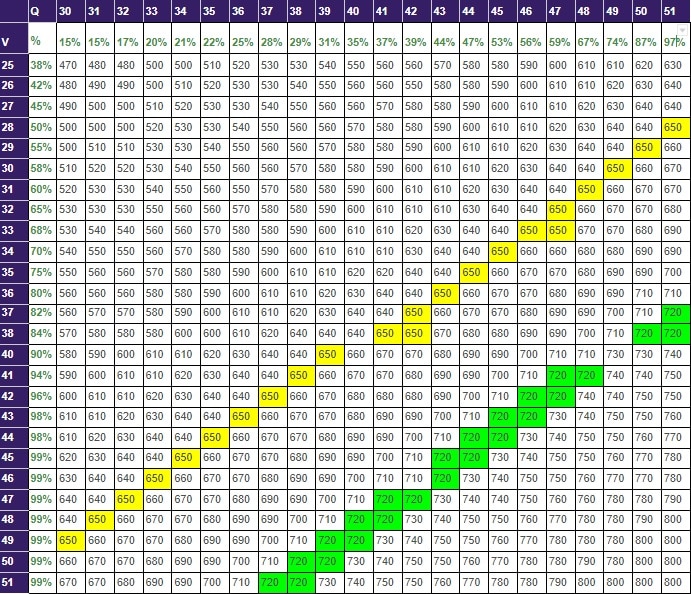 Or, use this interactive GMAT score chart to find out how your section scores create your overall score. Scroll left to see more Quant section scores, or use the search bar to look up a specific score. Q30313233343536373839404142434445464748495051 VPercentile15%15%17%20%21%22%25%28%29%31%35%37%39%44%47%53%56%59%67%74%87%97% 2538%470480480500500510520530530540550560560570580580590600610610620630 2642%480490490500510520530530540550560560550580580590600610610620630640 2745%490500500510520530530540550560560570580580590600610610620630640640 2850%500500500520530530540550560560570580580590600610610620630640640650 2955%500510510530530540550560560570580580590600610610620630640640650660 3058%510520520530540550560560570580580590600610610620630640640650660670 3160%520530530540550560550570580580590600610610620630640640650660670670 3265%530530530550560560570580580590600610610610630640640650660670670680 3368%530540540560560570580580590600610610620630640640650650670670680690 3470%540550550560570580580590600610610610630640640650660660680680690690 3575%550560560570580580590600610610620620640640650660670670680690690700 3680%560560560580580590600610610620630640640650660670670680690690710710 3782%560570570580590600610610620630640640650660670670680690690700710720 3884%570580580580600600610620640640640650650670680680690690700710720720 4090%580590600610610620630640640650660670670680690690700710710730730740 4194%590600610610620630640640650660670670680690690700710720720740740750 4296%600610610620630640640650660670680680680690700710720720740740750750 4398%610610620630640640650660670670680690690700710720720730740750750760 4498%610620630640640650660670670680690690700710720720730740750750760770 4599%620630640640650660670670680690690700710720720730740750750760770780 4699%630640640650660670670680690690700710710720730740750750760770770780 4799%640640650660670670680690690700710720720730740740750760760780780790 4899%640650660670670680690690700710720720730740750750760770780780790800 4999%650660670670680690690700710720720730740750750760770780780780800800 5099%660670670680690690700710720720730740750750760770780780790780800800 5199%670670680690690700710720720730740750750760770780780790800800800800 calculating GMAT percentiles. 700+ GMAT score is best. Spoiler: good GMAT prep can help you get there! So the key, as mentioned above, is understanding how your Verbal and Quant scores can be combined to get you to your target score. Using a GMAT scoring chart is a great way to view all kinds of combinations and scenarios, which can help you predict just how successful you’ll be on testing day. And of course, if your unofficial scores on practice tests don’t match your hopes on test day, you do have options! We have a few thoughts taking the GMAT again that can help you figure out whether to retake the exam—and help you ace the GMAT the next time around if you do. For more resources, I would recommend reading these following sites:
I’d love to hear what you think about this topic, our GMAT score calculator, and the corresponding GMAT score chart. Feel free to leave a comment below! The post GMAT Score Calculator (with GMAT Score Chart) appeared first on Magoosh Blog — GMAT® Exam. |
| FROM Magoosh Blog: GMAT Focus Edition: the Key Changes |
 “We want to encourage people with a broad set of qualifications, undergraduate backgrounds and lived experiences to understand the richness of their choice and take that leap forward on their business school journey.” said Joy Jones, CEO of GMAC The Graduate Management Admission Test (GMAT) is a crucial part of the application process for many business schools. With the introduction of the GMAT Focus Edition, it’s essential for aspiring graduate students to understand the changes and how they could impact the application process. This article aims to provide a comprehensive overview of the GMAT Focus Edition, summarizing key information from official sources, so you can make informed decisions about your business school applications. GMAT Focus Edition: What to Expect The GMAT Focus Edition is a new version of the GMAT, a mainstay exam of graduate admissions designed to asses skills that matter to business schools. According to the Graduate Management Admission Council (GMAC), registration for this updated test will open in August 2023. The primary goal of the GMAT Focus Edition is to streamline the testing experience while maintaining the same high standards as the previous version of the exam. The GMAT Focus Edition introduces several important updates aimed at enhancing the test-taking experience. These changes are outlined below:
What This Means for the GMAT Naturally, the current GMAT’s days are numbered. Expect it to be phased out sometime in early 2024, but if that’s the version you’ve taken or have prepped to take you don’t need to make any major changes. GMAC supports all GMAT scores as valid for 5 years, so there will be an extended transition period to the new test scores. In the meantime, it will be important to keep in mind that the scores do not translate. Here’s it’s worth quoting GMAC themselves: “Because the Total Score scale and the score scale distribution have both changed, comparing total scores or section scores from the current version of the exam to the GMAT Focus Edition is not appropriate, accurate, or a meaningful comparison of performance. Scores of 600 and 605 may look similar, but they represent very different performance levels on different skills.” Preparing for the GMAT Focus Edition The introduction of the GMAT Focus Edition is a significant change in the business school application process. By understanding the updates and utilizing the available prep resources, aspiring graduate students can confidently navigate these changes and excel in their applications. At Magoohs we’re ready for the change, and ready you prepare. GMAC also provides a variety of resources for test-takers to prepare for the GMAT Focus Edition. The post GMAT Focus Edition: the Key Changes appeared first on Magoosh Blog — GMAT® Exam. |
| FROM Magoosh Blog: SAT to GMAT Conversion: Can You Predict Your GMAT Score? |
 Are you a student preparing to take the GMAT? If so, then you’re probably wondering how exactly your SAT score may factor into the equation. While there is no definitive answer as to whether or not your SAT score can accurately predict your performance on the GMAT, it may provide an interesting indicator of what to expect! The two tests are very different from one another, but there are some similarities that can be used to estimate your performance on the GMAT. For example, both the SAT and the GMAT require strong analytical skills. As such, having a firm grasp of reading comprehension is key for either test. In addition, both exams heavily emphasize mathematics – though the focus may differ slightly for each. Still, making a direct score conversion would be challenging as the two tests differ in content, complexity and scoring scales. Although some attempts have been made to develop conversion tools or equations that estimate a potential GMAT score based on an SAT score, these tools should be approached with caution. They often lack precision and validity compared to official score conversion methods. Relying solely on such tools may lead to misleading predictions. It’s also important to bear in mind that a strong SAT score does not guarantee a top-notch GMAT performance. The GMATassesses different skills than those tested on the SAT so be sure to give yourself ample time to prepare specifically for the GMAT if you want to get the best possible results. Though it can prove difficult to predict your exact GMAT score based on an SAT score, understanding how certain skills developed from one test can transfer over into success on the other can help inform your study strategies and provide guidance as you move closer towards taking the GMAT. Developing strong analytical, critical thinking, and problem solving skills will be advantageous to achieving a competitive GMAT score. Dedicate time to reading and analyzing business-related articles, solving quantitative problems, and understanding data. Actively engage with relevant study materials and consistently practice to enhance these skills. Unfortunately, at the end of the day, your SAT score is not a valuable indicator for gauging potential GMAT performance. Its important to remember that the two tests are different and should not be seen as interchangeable. Use your SAT score as a starting point for understanding the areas of focus as you begin to prepare, and use that knowledge to create an effective study plan so that you can get the score you deserve on the GMAT. Good luck! The post SAT to GMAT Conversion: Can You Predict Your GMAT Score? appeared first on Magoosh Blog — GMAT® Exam. |
| FROM Magoosh Blog: GMAT vs. GMAT Focus Edition: Score Conversion (2023) |
 When it comes to business school admissions, the Graduate Management Admission Test (GMAT ) is a critical component of the application process. However, with the introduction of the GMAT Focus Edition, potential candidates are faced with a new dimension to consider. This article breaks down the differences between the regular GMAT and the GMAT Focus Edition, and how these variations may affect your scores and percentile rankings. The GMAT Scoring System With the introduction of the GMAT Focus Edition, there has been a significant shift in the scoring system which impacts percentile rankings. This new version introduces an updated score scale ranging from 205 to 805, with each score ending in a 5, a clear departure from the traditional GMAT Exam’s 200-800 range. This adjustment enables a clear differentiation between the scores from the GMAT Focus Edition and the traditional GMAT Exam. Moreover, the GMAT Focus Edition brings a more comprehensive evaluation into play. Unlike its predecessor, which calculated the Total Score based solely on Quantitative and Verbal Reasoning scores, the GMAT Focus Edition incorporates all three sections: Quantitative, Verbal, and Data Insights. Each section contributes equally to the Total Score, with individual section scores ranging from 60 to 90. What does this mean? Let’s consider an example to illustrate this difference. If two test takers, John and Jane, take the GMAT and the GMAT Focus Edition respectively, and both score 600 and 605, this does not indicate equivalent performance levels. John, who took the traditional GMAT, achieved his score based solely on his Quantitative and Verbal Reasoning skills. On the other hand, Jane’s score from the GMAT Focus Edition reflects her competencies in Quantitative, Verbal, and Data Insights sections. Hence, while their scores may seem close numerically, Jane’s 605 is a reflection of a broader skill set. This revised structure emphasizes a multi-faceted approach, underscoring the importance of versatility in skills. By considering your performance across all three areas, the GMAT Focus Edition provides a more holistic view of your prep. GMAT Focus Score Conversion To gain an understanding of how the standard GMAT scores align with the GMAT Focus Edition, take a look at the comprehensive Score Concordance table provided below. GMAT Score Percentile Ranking GMAT Focus Edition Score 800 100% 805 790 100% 805 780 100% 805 770 100% 805 760 99% 715 750 99% 715 740 98% 695 730 97% 695 720 95% 675 710 93% 665 700 90% 655 690 87% 645 680 83% 635 670 80% 615 660 78% 615 650 75% 615 640 71% 595 630 65% 585 620 63% 585 610 59% 575 600 55% 565 590 51% 555 580 48% 555 570 44% 545 560 41% 535 550 38% 525 540 35% 515 530 32% 515 520 28% 495 510 27% 495 500 25% 495 490 23% 485 480 21% 475 470 19% 475 460 18% 465 450 15% 455 440 14% 445 430 13% 445 420 12% 435 410 10% 425 400 9% 415 390 9% 415 380 8% 415 370 7% 405 360 6% 395 350 6% 395 340 5% 385 330 4% 375 320 4% 375 310 3% 355 300 3% 355 290 2% 335 280 2% 335 270 2% 335 260 2% 335 250 2% 335 240 1% 305 230 1% 305 220 1% 305 210 1% 305 200 0% 205 This table was provided by GMAC. Final Thoughts In conclusion, the GMAT Focus Edition has revolutionized the landscape of business school admissions tests, introducing a more comprehensive and holistic evaluation approach. The expansion of the score scale and the inclusion of a third section in the total score calculation provides candidates with a unique opportunity to showcase a wider range of competencies. As a result, it is crucial for candidates to grasp these differences and understand their impact on their scores. By doing so, you can strategically prepare for the exam and ensure that your scores truly reflect your dedication. Follow the Magoosh GMAT blog to stay up to date on the latest GMAT Focus news, test tips, and strategies. The post GMAT vs. GMAT Focus Edition: Score Conversion (2023) appeared first on Magoosh Blog — GMAT® Exam. |
| FROM Magoosh Blog: GMAT Focus Edition: Score Chart and Percentiles Rankings (2023) |
|
When it comes to business school admissions, the Graduate Management Admission Test (GMAT ) is a critical component of the application process. However, with the introduction of the GMAT Focus Edition, potential candidates are faced with a new dimension to consider. This article breaks down the differences between the regular GMAT and the GMAT Focus Edition, and how these variations may affect your scores and percentile rankings. The GMAT Scoring System With the introduction of the GMAT Focus Edition, there has been a significant shift in the scoring system which impacts percentile rankings. This new version introduces an updated score scale ranging from 205 to 805, with each score ending in a 5, a clear departure from the traditional GMAT Exam’s 200-800 range. This adjustment enables a clear differentiation between the scores from the GMAT Focus Edition and the traditional GMAT Exam. Moreover, the GMAT Focus Edition brings a more comprehensive evaluation into play. Unlike its predecessor, which calculated the Total Score based solely on Quantitative and Verbal Reasoning scores, the GMAT Focus Edition incorporates all three sections: Quantitative, Verbal, and Data Insights. Each section contributes equally to the Total Score, with individual section scores ranging from 60 to 90. What does this mean? Let’s consider an example to illustrate this difference. If two test takers, John and Jane, take the GMAT and the GMAT Focus Edition respectively, and both score 600 and 605, this does not indicate equivalent performance levels. John, who took the traditional GMAT, achieved his score based solely on his Quantitative and Verbal Reasoning skills. On the other hand, Jane’s score from the GMAT Focus Edition reflects her competencies in Quantitative, Verbal, and Data Insights sections. Hence, while their scores may seem close numerically, Jane’s 605 is a reflection of a broader skill set. This revised structure emphasizes a multi-faceted approach, underscoring the importance of versatility in skills. By considering your performance across all three areas, the GMAT Focus Edition provides a more holistic view of your prep. GMAT Focus Score Conversion To gain an understanding of how the standard GMAT scores align with the GMAT Focus Edition, take a look at the comprehensive Score Concordance table provided below. GMAT Score Percentile Ranking GMAT Focus Edition Score 800 100% 805 790 100% 805 780 100% 805 770 100% 805 760 99% 715 750 99% 715 740 98% 695 730 97% 695 720 95% 675 710 93% 665 700 90% 655 690 87% 645 680 83% 635 670 80% 615 660 78% 615 650 75% 615 640 71% 595 630 65% 585 620 63% 585 610 59% 575 600 55% 565 590 51% 555 580 48% 555 570 44% 545 560 41% 535 550 38% 525 540 35% 515 530 32% 515 520 28% 495 510 27% 495 500 25% 495 490 23% 485 480 21% 475 470 19% 475 460 18% 465 450 15% 455 440 14% 445 430 13% 445 420 12% 435 410 10% 425 400 9% 415 390 9% 415 380 8% 415 370 7% 405 360 6% 395 350 6% 395 340 5% 385 330 4% 375 320 4% 375 310 3% 355 300 3% 355 290 2% 335 280 2% 335 270 2% 335 260 2% 335 250 2% 335 240 1% 305 230 1% 305 220 1% 305 210 1% 305 200 0% 205 This table was provided by GMAC. Final Thoughts In conclusion, the GMAT Focus Edition has revolutionized the landscape of business school admissions tests, introducing a more comprehensive and holistic evaluation approach. The expansion of the score scale and the inclusion of a third section in the total score calculation provides candidates with a unique opportunity to showcase a wider range of competencies. As a result, it is crucial for candidates to grasp these differences and understand their impact on their scores. By doing so, you can strategically prepare for the exam and ensure that your scores truly reflect your dedication. Follow the Magoosh GMAT blog to stay up to date on the latest GMAT Focus news, test tips, and strategies. The post GMAT Focus Edition: Score Chart and Percentiles Rankings (2023) appeared first on Magoosh Blog — GMAT® Exam. |
| FROM Magoosh Blog: How to Understand Your GMAT Percentiles |
 How can you turn test scores and section scores into GMAT score percentiles? And what about GMAT Quant score percentiles and Verbal score percentiles? Don’t worry—we’ve got all the info you need to know to understand your score. First off, your total GMAT score ranges from 200-800, and your section scores have their own score scales as well. But focusing on your GMAT percentiles can give you extra insight into your strengths and weaknesses on the test. The GMAT is all about competitive advantage. Your score is literally determined by how well you perform in relation to hundreds of thousands of test-takers over the past three years. In a nutshell, a ranking in the 75th percentile means that 25% of test-takers performed as well or better than you, and 75% did not. Knowing the percentiles lets you know if you’ve merely achieved an average GMAT score, or if you’ve shot through the roof with your scores. GMAC produces this information on GMAT percentile charts. For your convenience, we’ve broken these scores down below. This post has been updated to include GMAC’s most recently published GMAT score percentiles, which represent a sample of 282,098 students who took the GMAT from 2020-2022. GMAT Score Percentiles Chart[/*] [*]GMAT Focus Edition[/*][*]GMAT Quant Percentiles[/*] [*]GMAT Verbal Percentiles[/*] [*]GMAT AWA Percentiles[/*] [*]GMAT IR Percentiles[/*] [*]How does GMAT calculate percentiles?
information on GMAT score calculations!) Click here for the GMAT Score Percentiles Chart Percentile Score Percentile (cont’d.) Score (cont’d.) 99% 760-800 24% 520 98% 750 21% 510 97% 740 20% 500 95% 730 18% 490 93% 720 16% 480 89% 710 15% 470 86% 700 13% 460 84% 690 12% 450 78% 680 10% 440 76% 670 9% 430 72% 660 9% 420 68% 650 8% 410 61% 640 7% 400 59% 630 6% 390 55% 620 6% 380 51% 610 5% 370 47% 600 5% 360 44% 590 4% 350 40% 580 4% 340 37% 570 3% 320-330 34% 560 2% 260-310 31% 550 1% 220-250 28% 540 0% 200-210 25% 530  MBA.com are the best way to get an accurate idea of how you are performing before test day.
as they did in 2014-2018), that means around:
retake the GMAT (and, unfortunately, pay the GMAT exam fee once more). Bear in mind that some schools will have minimum sectional scores for the Quant section as well. Others may insist on a ‘balanced score’ between the two sections. To understand the GMAT score you’ll need to obtain for a top school, the best thing to do is look at average GMAT scores for top programs. As you can see from running down this list, they all tend to be above 700–sometimes well above 700, as in the case of Columbia (an average of 732!). Put this in terms of percentiles using the chart above. A 700 on the GMAT is in the 87th percentile, while a 732 would be around the 96th percentile. From this information, we can draw the conclusion that top schools need top scores. Rankings don’t correspond precisely to score percentiles—but in this case, it’s pretty fair to say that if you’re applying to a top-10 school, a score in the top 10% of GMAT test-takers (i.e. placing you in the 90th percentile above) is definitely a helpful tool. How to Understand Your GMAT Percentiles appeared first on Magoosh Blog — GMAT® Exam. |
| FROM Magoosh Blog: GMAT Focus Edition: Score Chart and Percentiles Rankings (2023) |
 When it comes to business school admissions, the Graduate Management Admission Test (GMAT ) is a critical component of the application process. However, with the introduction of the GMAT Focus Edition, potential candidates are faced with a new dimension to consider. This article breaks down the differences between the regular GMAT and the GMAT Focus Edition, and how these variations may affect your scores and percentile rankings. The GMAT Scoring System With the introduction of the GMAT Focus Edition, there has been a significant shift in the scoring system which impacts percentile rankings. This new version introduces an updated score scale ranging from 205 to 805, with each score ending in a 5, a clear departure from the traditional GMAT Exam’s 200-800 range. This adjustment enables a clear differentiation between the scores from the GMAT Focus Edition and the traditional GMAT Exam. Moreover, the GMAT Focus Edition brings a more comprehensive evaluation into play. Unlike its predecessor, which calculated the Total Score based solely on Quantitative and Verbal Reasoning scores, the GMAT Focus Edition incorporates all three sections: Quantitative, Verbal, and Data Insights. Each section contributes equally to the Total Score, with individual section scores ranging from 60 to 90. What does this mean? Let’s consider an example to illustrate this difference. If two test takers, John and Jane, take the GMAT and the GMAT Focus Edition respectively, and both score 600 and 605, this does not indicate equivalent performance levels. John, who took the traditional GMAT, achieved his score based solely on his Quantitative and Verbal Reasoning skills. On the other hand, Jane’s score from the GMAT Focus Edition reflects her competencies in Quantitative, Verbal, and Data Insights sections. Hence, while their scores may seem close numerically, Jane’s 605 is a reflection of a broader skill set. This revised structure emphasizes a multi-faceted approach, underscoring the importance of versatility in skills. By considering your performance across all three areas, the GMAT Focus Edition provides a more holistic view of your prep. GMAT Focus Score Conversion To gain an understanding of how the standard GMAT scores align with the GMAT Focus Edition, take a look at the comprehensive Score Concordance table provided below. GMAT Score Percentile Ranking GMAT Focus Edition Score 800 100% 805 790 100% 805 780 100% 805 770 100% 805 760 99% 715 750 99% 715 740 98% 695 730 97% 695 720 95% 675 710 93% 665 700 90% 655 690 87% 645 680 83% 635 670 80% 615 660 78% 615 650 75% 615 640 71% 595 630 65% 585 620 63% 585 610 59% 575 600 55% 565 590 51% 555 580 48% 555 570 44% 545 560 41% 535 550 38% 525 540 35% 515 530 32% 515 520 28% 495 510 27% 495 500 25% 495 490 23% 485 480 21% 475 470 19% 475 460 18% 465 450 15% 455 440 14% 445 430 13% 445 420 12% 435 410 10% 425 400 9% 415 390 9% 415 380 8% 415 370 7% 405 360 6% 395 350 6% 395 340 5% 385 330 4% 375 320 4% 375 310 3% 355 300 3% 355 290 2% 335 280 2% 335 270 2% 335 260 2% 335 250 2% 335 240 1% 305 230 1% 305 220 1% 305 210 1% 305 200 0% 205 This table was provided by GMAC. Final Thoughts In conclusion, the GMAT Focus Edition has revolutionized the landscape of business school admissions tests, introducing a more comprehensive and holistic evaluation approach. The expansion of the score scale and the inclusion of a third section in the total score calculation provides candidates with a unique opportunity to showcase a wider range of competencies. As a result, it is crucial for candidates to grasp these differences and understand their impact on their scores. By doing so, you can strategically prepare for the exam and ensure that your scores truly reflect your dedication. Follow the Magoosh GMAT blog to stay up to date on the latest GMAT Focus news, test tips, and strategies. The post GMAT Focus Edition: Score Chart and Percentiles Rankings (2023) appeared first on Magoosh Blog — GMAT® Exam. |
| FROM Magoosh Blog: GMAT Test Dates | 2024-2025 and Beyond! |
 Both in-person and at-home GMAT test dates are available to test-takers this year—and both at-home and at a test center. In this post, we’ve covered some more vital information about the GMAT test dates for 2024—read on to find out more! GMAT Test Dates (2024-2025)[/*] [*]The 3 Steps to Scheduling Your GMAT Test Date[/*] [*]MBA application dates [*]When do I need to register for the GMAT?[*]When should I plan on taking the GMAT?[/list] online, at-home GMAT testing options. Meanwhile, the GMAC (test-maker) began to offer the remote GMAT in April 2020; it’s offered every day, with multiple time slots. However, popular days and times can still fill up—the remote proctor aspect of the testing means that there are still limits to how many test-takers can sign up for the exam at a given time. With all of these GMAT test dates to choose from, should you just throw a dart at a calendar? No! You’ll ned to be strategic about picking your test date, because you’ll need your score for whatever MBA application round you choose. We’ll talk more about this later i the post!  GMAC’s “Create Your Account” page to get started. Once that’s done, you’ll have the ability to browse and see your options for GMAT dates (and locations, if applicable). Step 2a: Find a test center with available GMAT dates Once you’ve registered with GMAC and have the ability to look at GMAT exam dates, the next step is to find a GMAT test center. For in-person dates, look under “Future GMAT Test Center Exams” and click “Register Now” or “Register as a Test Taker with Disabilities.” Each of these buttons will take you to options for your location. Remember, the farther in advance you book your GMAT, the more options you’ll have for both GMAT locations and GMAT dates. Step 2b : Pick a date for the online GMAT Because the online GMAT is available every day, the key to picking a GMAT test date online is finding the day and time that work best for you. To find test dates for a remote GMAT, select “Register for the GMAT Online Exam” under “Future GMAT Online Exams” on your MBA.com “My Account” page. Click on dates to see available time options. Step 3: Schedule Your Exam Once you know which test format you want to take and are registered to take the GMAT, you’re ready to actually select your GMAT test date. Follow the on-screen instructions within your GMAT account. Of course, there’s a lot more to registering for the GMAT and choosing your test date than just accessing and navigating the official GMAT website. Timing is a crucial consideration too. Below, we’ll look at when to register, and how to select the GMAT test date that’s right for you. top MBA programs. Most top schools set MBA application deadlines three times a year, in three rounds. Check with specific schools for exact deadlines for Round 1, Round 2, and Round 3. And check out this article for help figuring out which round you should apply in. As you can imagine dates for MBA application rounds have a lot of implications for GMAT dates. GMAT examination. GMAC says it can take up to 20 days for your test to be reported to schools. That could actually mean 21 days, depending on whether your test day scores get transmitted from the test center to GMAT central the same day you take the test or the next day. There’s also a small chance that for some reason there could be unexpected delays in the GMAC sending our scores. So, beyond GMAT exam dates, you should consider the dates of arrival for your GMAT exam report. To be safe, you’ll want to book your GMAT date at least 21 days prior to your application deadline, so that there is ample time for your scores to be processed and sent to your school. Giving yourself a few extra days beyond the 21 can’t hurt either. So really, there’s an extra month in there. That’s why I recommend taking your GMAT 7-8 months before your deadline instead of just 6-7.
Of course, your mileage may vary, in terms of how much time you really need and when you should register for the GMAT. If you have more than 20 hours a week to study or have higher-than-average GMAT skills, you may need less time to prepare for your exam or a possible retake. Conversely, if you have fewer hours of spare time per week or lower baseline skills for the exam, you may need to reserve more prep time before you actually take the test. Also, while it isn’t as common, some students get all of the soul searching, university visits, reference letter gathering and so on out of the way before they tackle the GMAT. If this sounds like you, then your GMAT prep time and GMAT exam date will take a different position in your overall timetable for admissions. Improve your GMAT scores with Magoosh GMAT, you can choose between a live cohorted class with an instructor (which includes all our lessons and practice questions) or access to the self-study option by itself. The post GMAT Test Dates | 2024-2025 and Beyond! appeared first on Magoosh Blog — GMAT® Exam. |
| FROM Magoosh Blog: Current GMAT Format and Section Breakdown |
|
The GMAT format can be broken down into three sections: Data Insights (20 questions), Quantitative (21 questions), Verbal (23 questions). Each section is 45 minutes for a total exam time of 2 hours and 15 minutes. Keep reading to learn more about the full GMAT exam format. Exam Format and Sections of the GMAT[/*] [*]6 Facts You Should Know About the GMAT Exam Format[/*] [*]GMAT Format Resources[/*] [*]Summing It All Up[/*] [/list] Data Insights [/*] [*]Quantitative [*]Verbal 6 Facts You Should Know About the GMAT Exam Format
If you are just getting starting in your GMAT studies, take heart. I know this can all feel overwhelming when it’s all new. Be patient with yourself: step by step, you will make this new world your own. We definitely recommended getting an official guide: you don’t necessarily need the latest edition, if you can find last year’s edition at a much cheaper price. A great—and free!—supplement is our Hassle-Free Guide to the GMAT. Aside from the format of the GMAT, it covers everything including how a GMAT practice test can help to kick off your GMAT prep. We provide a variety of study schedules and we provide a GMAT Diagnostic Test that helps you place yourself in these study plans. Summing It All Up Knowing the GMAT format is just the first piece of the puzzle. The GMAT requires critical thinking skills, mastery of several math & verbal content areas, a host of test-taking strategies. Magoosh can help with it all: we can guide you from your first tentative steps to your final bold strides toward the GMAT. We can help you solve the entire GMAT puzzle, from the first piece to the last! The post Current GMAT Format and Section Breakdown appeared first on Magoosh Blog — GMAT® Exam. |
| FROM Magoosh Blog: Navigating Your MBA Journey: Choosing Between the GRE and GMAT |
 Embarking on the path to business school is an exhilarating venture filled with critical decisions, one of which is selecting the right entrance exam. In the realm of MBA admissions, whether to take the GRE or GMAT has become a question almost every applicant considers. This comprehensive guide is tailored to help you, a prospective business school student, navigate this decision with clarity and confidence. Understanding the GRE and GMAT First, let’s demystify these two exams: GMAT (Graduate Management Admission Test): Crafted explicitly for business school applicants, the GMAT is owned and administered by the Graduate Management Admission Council (GMAC. The GMAT evaluates analytical, quantitative, logic, and reading skills in business-oriented contexts. GRE (Graduate Record Examination): Is owned and administered by the Education Testing Service ETS. The GRE serves a broader array of graduate programs, including business and some law school and tests your verbal reasoning, quantitative reasoning, and analytical writing skills. Choosing between these tests can influence your MBA application journey profoundly. Here’s what you should consider: What Are Your Personal Preferences? Committed to an MBA or considering other options? The GRE is your ticket if you’re eyeing multiple graduate programs besides an MBA. Its scores are widely accepted across various disciplines. Section vs. question adaptability? The GRE is section adaptive, which allows you to mark, skip, and change as many answers as you see fit within a section. The GMAT is question adaptive. That means you must submit an answer before proceeding to the next question. You are allowed to flag questions for review and may go back and change answers on the GMAT, but you must complete the section first, and you can only change your answers to a maximum of three questions. Given these differences, the flexibility of the GRE might align better with your test-taking style. Math or verbal? Are you more comfortable on the math or verbal side of the aisle? The GRE tends to be better suited for those whose strengths lean towards verbal reasoning. The text complexity and vocabulary of the GRE are quite difficult to navigate, especially for non-native English speakers. Furthermore, the GRE, unlike the GMAT, provides an on-screen calculator (its helpfulness is debatable  ) for its quant section. On the flipside, if your strengths lie in quantitative reasoning and data analysis, then the GMAT’s intense Quantitative and Data Insights sections might be more up your alley. Can you take either test?: Nowadays, it’s almost unheard of for a business program to have a preference for the GMAT over the GRE. Thus, your choice of school will unlikely limit your test options. However, it’s always wise to check the preferred tests for your target programs. Essay vs. no essay? GRE test-takers will begin their tests with a 30-minute Analytical Writing Assessment (AWA). GMAT test-takers will not have to compose an essay as the GMAT does not include an AWA. (Slightly) shorter or longer exam?: The GRE takes just under two hours and consists of one essay, two Verbal Reasoning sections and two Quantitative Reasoning sections. The GMAT takes just over two hours and consists of one Verbal reasoning, one Quantitative reasoning, and one Data Insights section. The Deciding Factors for Your business School Journey Self-Assessments: To truly know whether you should opt for the GRE or GMAT, put yourself to the test, literally! Practice tests can be a goldmine of insight. Your comfort with each test’s format and questions should play a significant role in your decision. Of course, you want to be sure to take high-quality practice tests likeMagoosh’s Free GRE practice test and Magoosh’s Free GMAT practice test, which closely mimic the official exams. Preparation Strategy: Take an honest look at your study habits, how much time you have to devote to study, and whether you are already someone who is more comfortable with verbal versus quantitative subject matter. The requisite time commitment, your access to preparation resources, and applicable test-taking strategies might align better with one test’s structure over the other. Alumni and Network Insights: Speaking with current students or alumni about their experiences and how their test choice impacted their MBA journey can provide valuable perspectives. Conclusion Your decision between the GRE and GMAT should be informed by a deep understanding of each test’s nuances and how they align with your strengths as a test taker. Whether you choose the GRE’s flexibility or the GMAT’s business-oriented focus, your decision is a step toward realizing your MBA dreams. Here’s to making an informed choice that paves the way for your success in business school! Happy studying, and best of luck on your MBA journey! The post Navigating Your MBA Journey: Choosing Between the GRE and GMAT appeared first on Magoosh Blog — GMAT® Exam. |
| FROM Magoosh Blog: Data Insights Practice Problem: Multi-Source Reasoning |
Card #1 Whizzo Chocolate Company in Chicago, IL, makes a wide variety of exceptionally high quality confections. Each one of their products can be classified into one of 5 groups. (Weights include all necessary packaging for shipping.) 1) 12-piece assortments (1.5 lbs, $14.99), some of which require refrigerated shipping and some of which do not. 2) 20-piece assortments (2.0 lbs, $24.99), some of which require refrigerated shipping and some of which do not. 3) a small chocolate-covered fruit basket (12 lb, $39.99), which requires refrigerated shipping 4) a large chocolate-covered fruit basket (30 lb, $59.99), which requires refrigerated shipping 5) an all-chocolate chessboard with white & dark chocolate chessmen (25 lb, $149.99), which requires refrigerated shipping Card #2 Whizzo Chocolate Company uses only the following shipping methods Western Food Sender a) WFS non-refrigerated service: $50 plus $10 times each pound b) WFS refrigerated service: $80 plus $15 times each pound Card #3 If a single order is a “mixed order”, that is, it contains both items that require refrigerated shipping and items that do not require refrigerated shipping, it does no harm to the latter items to ship them in refrigerated shipping. If a single order is a mixed order, customer has a choice: a) only items requiring refrigerated shipping sent via refrigerated shipping , and all other items sent without refrigeration b) all items, regardless of type, sentvia refrigerated shipping When a customer places a mixed order, the Whizzo sales representative will make this choice clear to the customer, and make clear that absolutely no damage will occur by refrigerating those items which don’t require refrigeration. Practice Problems 1) If a person in Pennsylvania has a total of $500 to spend on a Whizzo order, which of the following orders could he afford, including the cost of shipping? five 12-piece assortments, all requiring refrigerated shipping Yes No two large chocolate-covered fruit basket Yes No the all-chocolate chessboard with white & dark chocolate chessmen Yes No 2) For each of the following “mixed orders”, each containing twenty items total, which shipping option will be less expensive? Option A) only items requiring refrigerated shipping sent via refrigerated shipping , and all other items sent without refrigeration Option B) all items, regardless of type, sent via refrigerated shipping fifteen 12-piece assortments requiring refrigerated shipping and five 12-piece assortments not requiring refrigerated shipping A B ten 12-piece assortments requiring refrigerated shipping and ten 12-piece assortments not requiring refrigerated shipping A B five 12-piece assortments requiring refrigerated shipping and fifteen 12-piece assortments not requiring refrigerated shipping A B Answers and Explanations (1) Yes; No; No; (2) B, A, A; 1) Base cost of five 12-piece assortment = 5 x $14.99 = $74.95. Combined weight = 5 x 1.5 = 7.5 lb. Refrigeration required. Shipping cost = 80 + 15*75 = $192.50 Total cost = $74.95 + $192.50 = $267.45 -> affordable Base cost of two large chocolate-covered fruit basket = 2 x $59.99 = $119.98 Combined weight = 2 x 30 = 60 lb Shipping cost = 80 + 15*60 = $980 -> way over budget Base cost of all-chocolate chessboard = $149.99 Weight = 25 lbs Shipping cost = 80 + 15*25 = $455 -> over budget 2) Suppose you have a mixed order and it is all going to be sent via refrigerated shipping. That cost $80 + $15*(# of pound). Suppose some items, not requiring refrigeration, are removed from that shipment, and a non-refrigerated shipment is created. The additional cost is the $50 base cost of a non-refrigerated shipment. The savings per pound is the difference in the per pound rates: $15/lb – $10/lb = $5/lb. When will this saving exceed the additional $50 cost? When the total weight of the non-refrigerated shipment exceeds 10 lbs. The first order has five 12-piece assortments not requiring refrigerated shipping: 5 x 1.5 = 7.5 lbs of goods not requiring refrigerated shipping. That is not enough to justify a separate non-refrigerated order. The second order has ten 12-piece assortments not requiring refrigerated shipping: 10 x 1.5 = 15 lbs of goods not requiring refrigerated shipping. That is enough to justify a separate non-refrigerated order. The third order has even more weight not requiring refrigerated shipping, so this one will also justify a separate non-refrigerated order. BTW, the name “Whizzo Chocolate Company” is my homage to a classic Monty Python skit. The post Data Insights Practice Problem: Multi-Source Reasoning appeared first on Magoosh Blog — GMAT® Exam. |
| FROM Magoosh Blog: Guide to GMAT Data Insights |
|
Data Insights (DI) was introduced in 2023 when GMAC released a new version of the GMAT. Your performance on the Data Insights section will account for one third of your total GMAT score. You’ll have 45 minutes to answer 20 Data Insights questions, which will involve a ton of data analysis, critical thinking, and quantitative reasoning. When you first encounter DI question types, you might wonder just how one possibly navigates all that information. But! By preparing early and practicing a whole lot of questions, you’ll be ready to take on whatever DI throws at you on test day. What is GMAT Data Insights? The Data Insights section tests your quant-based and verbal-based reasoning in five parts:
You should expect to see 20 questions in 45 minutes. Some prompt types will have multiple questions. In addition, you’ll have to answer a question before you can move on—and you can’t go back to a question once you’ve answered it. Data Insights Question Types on the GMAT Multi-Source Reasoning Multi-source reasoning questions show you a split screen: on the left, you’ll have three clickable cards, each with a piece of information that will help you answer a particular question, and which you can only see one of at a time. The questions are either standard five-choice multiple choice or multiple dichotomous choice. You’ll have two answer choices (e.g. “true/false”) for each part of a three-part question. Here are more examples of multi-source reasoning problems! Table Analysis Table analysis questions give you a sortable table of numbers. These are accompanied by multiple dichotomous choice questions, in which you have two answer choices (e.g. “true/false”) for each part of a three-part question. Check out a sample table analysis problem! Graphics Interpretation For graphics interpretation questions, you’ll receive some visual information in the form of a chart or a graph, then questions containing two drop-down menus each. These menus will have you fill in blanks within a sentence according to the data shown in the visual. Check out more sample graphics interpretation problems! Two-part Analysis Two-part analysis questions give you a large prompt, followed by a question-and-answer table. You will fill out the answers for each of two questions, which can vary; they may be partially or completely related, but they will always be interdependent. Check out a sample two-part analysis problem! Data Sufficiency On the GMAT, the format of each Data Sufficiency problem is the same: you’re given a question and two statements. It’s up to you to decide whether the statements give you enough information to answer the question. You don’t need to give the answer to the actual question. You just have to decide whether either statement (or both statements) gives data that is sufficient for finding an answer—hence the term data sufficiency! Furthermore, there are two kinds of data sufficiency questions: Yes/No and Value questions. You’ll see each type in the practice problems below. Check out a sample Yes/No Data Sufficiency Question Check out a sample Value Data Sufficiency Question Strategies for Performing well on GMAT Data Insights So how do you get through 20 complex questions in only 45 minutes? Here are a few keys to succeeding:
GMAT Data Insights questions are designed to throw a lot of data at you, fast. And while a lot of test-takers will let that throw them off their game, you can ensure that you’re all set for test day by familiarizing yourself with these question types and practicing, practicing, practicing! The more used to the question types you are, the easier your test day experience will be. Good luck! The post Guide to GMAT Data Insights appeared first on Magoosh Blog — GMAT® Exam. |
| FROM Magoosh Blog: Data Insights Questions: Graphics Interpretation |
There are twelve practice questions in this set. You should feel free to use a calculator here because an on-screen calculator will be available during the Data Insights section.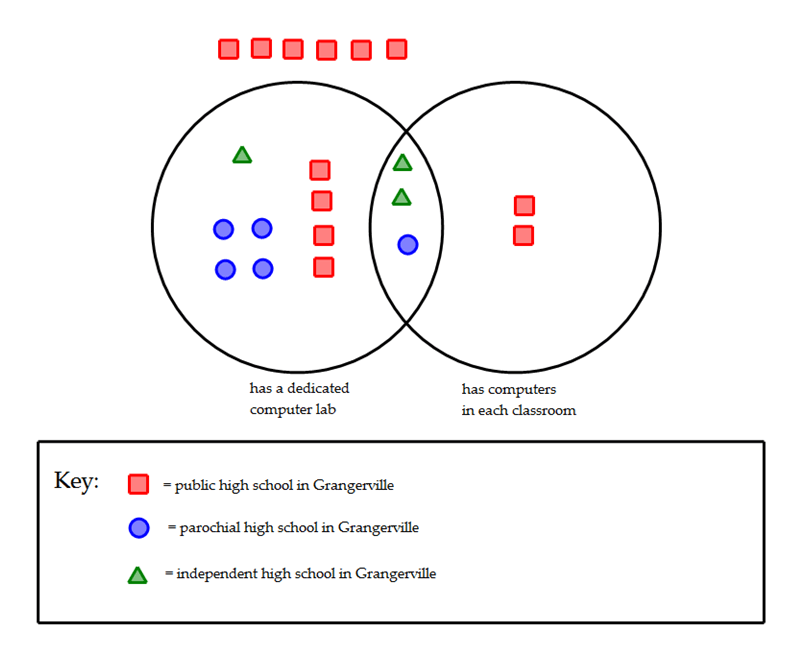 The chart above shows the technology capabilities of the 20 existing high schools in Grangerville. Questions 1) If a Grangerville high school is chosen at random, the probability that it will be public high school with a dedicated computer lab is: (A) 20% (B) 33.3 % (C) 40% (D) 42.9% (E) 44.4% 2) If a Grangerville high school with either a dedicated computer lab or a computer in every classroom is chosen, the probability that it will be a public school is: (A) 20% (B) 33.3 % (C) 40% (D) 42.9% (E) 44.4% 3) If a Grangerville high school with a dedicated computer lab is chosen, the probability that it will be a public school is: (A) 20% (B) 33.3 % (C) 40% (D) 42.9% (E) 44.4% 4) If a Grangerville high school with a dedicated computer lab and without a computer in every classroom is chosen, the probability that it will be a public school is: (A) 20% (B) 33.3 % (C) 40% (D) 42.9% (E) 44.4% 5) Which of the following statements is true? I. Independent schools constitute the high percentage of high schools in Grangerville with both a dedicated computer lab and a computer in every classroom II. Public Schools are tied for the highest percentage of high schools of Grangerville with a dedicated computer lab. III. Public Schools constitute the highest percentage of high schools of Grangerville with either a dedicated computer lab or a computer in every classroom. (A) I only (B) II only (C) III only (D) I and II (E) I and III 6) If a public high school in Grangerville is chosen at random, the probability that it has a dedicated computer lab is: (A) 16.7% (B) 33.3% (C) 66.7% (D) 80% (E) 100% 7) If a public high school in Grangerville is chosen at random, the probability that it has a computer in every classroom is: (A) 16.7% (B) 33.3% (C) 66.7% (D) 80% (E) 100% 8 ) If a public high school in Grangerville is chosen at random, the probability that it has a dedicated computer lab and does not have a computer in every classroom is: (A) 16.7% (B) 33.3% (C) 66.7% (D) 80% (E) 100% 9) If a parochial high school in Grangerville is chosen at random, the probability that it has a dedicated computer lab is: (A) 16.7% (B) 33.3% (C) 66.7% (D) 80% (E) 100% 10) If a parochial high school in Grangerville is chosen at random, the probability that it has a dedicated computer lab and does not have a computer in every classroom is: (A) 16.7% (B) 33.3% (C) 66.7% (D) 80% (E) 100% 11) If an independent high school in Grangerville is chosen at random, the probability that it has a dedicated computer lab is: (A) 16.7% (B) 33.3% (C) 66.7% (D) 80% (E) 100% 12) If an independent high school in Grangerville is chosen at random, the probability that it has a dedicated computer lab and does not have a computer in every classroom is: (A) 16.7% (B) 33.3% (C) 66.7% (D) 80% (E) 100% Practice Question Answers and Explanations (1) A; (2) D; (3) B; (4) E; (5) E; (6) B; (7) A; (8) B; (9) E; (10) D; (11) E; (12) B. 1) There are twenty school total. Of those twenty, only four are in the category “public school with a dedicated computer lab” – the four red squares in the Venn circle on the left. 4/20*100 = 20%. Answer = A. 2) There are 14 schools in one of the two Venn circles – those are the schools either with dedicated computer labs or a computer in every classroom. Of those schools, 6 are public: the four red squares in the left Venn circle, and the two in the right Venn circle. 6/14*100 = 42.9%. Answer = D. 3) There are 12 in the left Venn circle (including the overlap region) – those are the schools with dedicated computer labs. Of those, four are public schools – the four red squares in the Venn circle on the left. 4/12*100 = 33.3%. Answer = B. 4) When the overlap region is subtracted from the left Venn circle, the resultant lune holds the high schools with a dedicated computer lab and without a computer in every classroom. There are nine schools in this region, of which 4 are public: the four red squares in that left-most lune. 4/9*100 = 44.4% Answer = E. 5) Evaluate the statements one by one. Statement I: Independent schools constitute the high percentage of high schools in Grangerville with both a dedicated computer lab and a computer in every classroom. Schools with both a dedicated computer lab and a computer in every classroom are the overlap region of the two Venn circles. There are three schools in that region, and two are independent, so independent schools constitute the majority of that region. Statement I is true. Statement II: Public Schools are tied for the highest percentage of high schools of Grangerville with a dedicated computer lab. The schools with a dedicated computer lab are the left Venn circle, the whole of the circle including the overlap region. In this circle, there are 12 schools —- 5 parochial, 4 public, and 3 independent. Therefore, parochial schools only constitute the highest percentage of that region, and public schools are a clear second. Statement II is false. Statement III: Public Schools constitute the highest percentage of high schools of Grangerville with either a dedicated computer lab or a computer in every classroom. Schools with either a dedicated computer lab or a computer in every classroom constitute the combined area of the two Venn circles. There are 14 schools in that region —- 6 public, 5 parochial, and 3 independent. Public schools constitute the majority of that region. Statement III is true. Answer = E 6) There are 12 public high schools – the 12 red squares throughout the diagram, including those at the top. Of these, four are in the left Venn circle, which represents having a dedicated computer lab. 4/12*100 = 33.3%. Answer = B. 7) There are 12 public high schools. Of these, two are in the right Venn circle, which represents having a computer in every classroom. 2/12*100 = 16.7% Answer = A. 8 ) There are 12 public high schools. Of these, there are four in the left-most Venn lune (i.e. the left circle with the overlap subtracted). This region represents the schools that have a dedicated computer lab and do not have a computer in every classroom. 4/12*100 = 33.3%. Answer = B. 9) There are 5 parochial schools in the diagram – the five blue circles. All five of these are in the left Venn circle, which represents having a dedicated computer lab. 5/5*100 = 100%. Answer = E. 10) There are 5 parochial schools in the diagram. Of these, four of them are in the left-most Venn lune, which represents the schools that have a dedicated computer lab and do not have a computer in every classroom. 4/5*100 = 80%. Answer = D. 11) There are 3 independent schools in the diagram – the three green triangles. Of these, all three are in the left Venn circle, which represents having a dedicated computer lab. 3/3*100 = 100%. Answer = E. 12) There are 3 independent schools in the diagram. Of these, only one is in the left-most Venn lune, which represents the schools that have a dedicated computer lab and do not have a computer in every classroom. 1/3*100 = 33.3%. Answer = B. The post Data Insights Questions: Graphics Interpretation appeared first on Magoosh Blog — GMAT® Exam. |
| FROM Magoosh Blog: GMAT Tricks with Systems of Equations |
|
Many GMAT test-takers vaguely remember a rule from high school, that it’s possible to solve for two variables if and only if you’re given two equations, and generally that it’s possible to solve for n variables if and only if you’re given n equations. Unfortunately, that rule isn’t quite correct as written, and even the correct rule isn’t always relevant. Applying the rule incorrectly causes quite a few errors on the quant section, particularly with Data Sufficiency questions. Sometimes, two equations aren’t enough to allow us to solve for two variables, or even for one. That is, sometimes, information that seems sufficient isn’t in fact sufficient. The trick was that the rule above isn’t correct as written. The correct rule is that a system of n distinct linear equation is sufficient to solve for n variables, but that sometimes the GMAT gives you systems of equivalent (not distinct) equations, or exponential or quadratic (not linear) equations, and that the rule doesn’t apply to such systems. Today, we’ll see that sometimes information that doesn’t seem sufficient turns out to be, even when the equations in question are distinct and linear. How does that happen? GMAT Systems of Equations: Sample Problem Take a minute or two to answer this problem: Andres bought exactly two sorts of donuts, old-fashioned donuts and jelly donuts. If each old-fashioned donut costs $0.75 and each jelly donut costs $1.20, how many jelly donuts did Andres buy? (1) Andres bought a total of eight donuts. (2) Andres spent exactly $7.35 on donuts. (A) Statement (1) ALONE is sufficient, but statement (2) alone is not sufficient. (B) Statement (2) ALONE is sufficient, but statement (1) alone is not sufficient. (C) BOTH statements TOGETHER are sufficient, but NEITHER statement ALONE is sufficient. (D) EACH statement ALONE is sufficient. (E) Statements (1) and (2) TOGETHER are NOT sufficient. In this case, if we too quickly apply the rule described above, we’ll probably choose (C) after a bit of algebra. It turns out, though, that (C) is not the correct answer. Let’s Translate This Into GMAT Algebra Let j=the number of jelly donuts Andres purchased and 1.2j=the amount that Andres spent on jelly donuts. Note that we want to solve for j. Let f=the number of old-fashioned donuts Andres purchased and 0.75f=the amount that Andres spent on old-fashioned donuts. The question stem doesn’t give us an equation. (Well, it could give us 1.2j+0.75f=t, where t=the total dollars spent on donuts, but that equation isn’t useful.) We can rewrite statement (1) as an equation: (1) j+f=8 Obviously that doesn’t allow us to solve for j. Eliminate answers (A) and (D). We can rewrite statement (2) as an equation: 1.2j+0.75f=7.35 This doesn’t seem to be sufficient either. After all, solving for j yields a weird variable expression, j=6.125-0.833…f. So we’ll probably eliminate (B) as well. You could solve for j using both statements together but you don’t really need to do the math, since they’re obviously distinct linear equations. It’s enough to note that they are sufficient together without actually figuring out that j=3. What’s Wrong With That Approach? The trouble with that approach is that (2) is in fact sufficient. Yes, if we look at Statement (2) merely as an algebraic equation and we ignore the story that gave rise to the equation, then we have an infinite number of solutions for the pair j and f. Let’s make a little function table, assigning simple integer values to f and letting those determine corresponding values for j: f j 1 5.5 2 4.875 3 4.25 4 3.625 5 3 6 2.275 . . . . Do you see the trap? For every value of f except f=5, j turns out to be a mixed number. The story imposed an implicit constraint, that the values for f and j be positive integers. It turns out that this constraint means that there is exactly one acceptable solution to the equation in Statement (2), and so that the answer is (B) rather than (C). How Should I Solve Such a Problem? When a DS story problem yields a system of distinct linear equations but implicitly requires that solutions be integers, the smart thing to do is to test values. Generally the numbers involved won’t be very large, so the arithmetic won’t be too daunting. Above I stipulated a value for f and then determined a value for j. It might look as though I did this solely because I’d already rewritten Statement (2) as a function from f to j. I had another reason to start with f though: I can more easily see if a number is a multiple of 1.2 than of 0.75. Sound mysterious? Let’s see how we’d actually check for possible integer solutions to Statement (2). First, stipulate an integer value for f, then calculate 0.75f, then subtract that product from 7.35 to see how much money is left for jelly donuts. If the money left isn’t a multiple of 1.2, don’t consider it further: f .75f 7.35-0.75f multiple of 1.2? 1 0.75 6.60 no 2 1.50 5.85 no 3 2.25 5.10 no 4 3.00 4.35 no 5 3.75 3.60 yes 6 4.50 2.85 no 7 5.25 2.10 no 8 6.00 1.35 no 9 6.75 0.60 no So, can we do subtler math instead of this brute force? Yes, but it would be a bad idea on the GMAT, so we’re not going to go into it. The post GMAT Tricks with Systems of Equations appeared first on Magoosh Blog — GMAT® Exam. |
| FROM Magoosh Blog: GMAT Sample Data Sufficiency Practice Questions |
|
Unlike Problem Solving, Data Sufficiency is a question-type unique to the GMAT. Data Sufficiency is part of the Data Insights section on the GMAT. GMAT Data Sufficiency Practice Questions 1. Maggie is 15 years older than Bobby. How old is Bobby? Statement #1: In 3 years, Maggie’s age will be 50% larger than Bobby’s age. Statement #2: Years ago, when Maggie was 25 years old, Bobby was 10 years old. 2. By abc we denote a three digit number with digits a, b, and c. Is abc divisible by 3? Statement #1: The product of (a) times (b) is a number divisible by 3 Statement #2: c = 3 3. The ratio of underclassmen to upperclassmen in a particular school is 4:5. How many underclassmen are there? Statement #1: If the number of upperclassmen increased by 20%, then underclassmen would constitute 40% of this larger student body. Statement #2: If 10 more underclassmen joined the school, the new ratio of underclassmen to upperclassmen would be 9:10. 4. An oddly shaped die has N sides, numbered from 1 to N, that are equally likely to appear on a throw. Let P be the probability that at least one “1” appears in two throws. Is P < (1/5)? Statement #1: N is a prime number Statement #2: N > 5 5. Set S consists of all the positive multiples of 5 that are less than K, and K is a positive integer not divisible by 5. The mean of Set S is not divisible by 5. Let N be the number of members of the set. N is not divisible by 5. What does N equal? Statement #1: N < 52 Statement #2: K/5 > 48 6. The numbers D, N, and P are positive integers, such that D < N, and N is not a power of D. Is D a prime number? Statement #1: N has exactly four factors, and D is a factor of N Statement #2: D = (3^P) + 2 Answers and Solutions 1. Let M = Maggie’s age right now, and let B = Bobby’s age right now. The prompt gives us the equation M = B + 15. Statement #1 gives us a second equation, (M + 3) = 1.5*(B + 3). Notice that I used a multiplier for the percent increase. With this equation and the prompt equation, we have two equations with two unknowns, so we can solve for the values of M & B. We don’t need to perform those calculations: it is enough to know that we could. This statement, alone and by itself, is sufficient. Statement #2 is already obvious from the prompt. If Maggie is 15 years older than Bobby, then when Maggie was 25, Bobby would have had to have been 10. There’s no surprise there. We are given absolutely no indication when these people were these ages, so this doesn’t help us at all. This statement, alone and by itself, is not sufficient. Answer = (A) 2. Remember, the divisibility rule: if the sum of all the digits in a large number is divisible by 3, then the number itself is divisible by three. The problem with statement #1, for any given values of a & b that work, the one’s digit, c, could be anything. For example, a = 1, and b = 3 satisfy this condition, so that would be all the numbers in the 130’s: {130, 131, 13, 133, 134, 135, 136, 137, 138, 139}. Clearly, some of these are divisible by 3, namely {132, 135, 138} and the others aren’t. This statement allows for multiple answers, so this statement, alone and by itself, is not sufficient. The problem with statement #2 is that we now know the one’s digit, but the other two digits could be anything. Think about the first few possible numbers of this form: {103, 113, 123, 133, 143, 153, 163, 173, 183, 193, 203}. Of those, only (123, 153, 183) are divisible by three, and the others aren’t. In fact, you would be expected to know this, but as it happens, {103, 163, 173, 193} are prime numbers, not divisible by anything! This statement also allows for multiple answers, so this statement, alone and by itself, is not sufficient. Combined statements: now, we have to obey both constraints. One number that obeys both constraints is 133, which is not divisible by 3. Another number that obeys both constraints is 333, which is divisible by 3. Even with both statements in place, we can find numbers that produce either a “yes” or a “no” to the prompt. Even together, the statements are not sufficient. Answer = (E) 3. We are given “ratio information” and we want actual numbers. To get counts, actual numbers of people, we need something besides more ratio information. Statement #1 just gives us more “ratio information,” so we can’t solve for counts. This statement, alone and by itself, is not sufficient. Statement #2 gives us some actual counts. Let N and P represent the current underclassmen and upperclassmen, respectively, in the school. We know N/P = 4/5 from the prompt. From this statement, we know (N + 10)/P = 9/10. Together, we have two equations for two unknowns, so we could solve for the values of N & P. This statement, alone and by itself, is sufficient. Answer = (B) 4. First of all, if the N sides are equally likely, the probability of getting “1” on a single throw, or any particular side on a single throw, is 1/N. The probability of not getting “1” on a single throw, or not getting any particular side, is (1 – 1/N) = (N – 1)/N. For relatively low values of N, then getting “1” is relatively more likely, and getting something else is relatively less likely. As N gets bigger, the probability of getting “1” on a single throw decreases, and the probability of getting something else increase. What really makes the difference in this probability is the size of N. This is an at least probability, so we calculate the probability of getting something other than one on two consecutive throws, and then subtract this from 1. Statement #1: this statement is not very helpful. If N = 2, then essentially, the “two-sided die” is a coin, and if H = 1, then the probability of not getting a “1” is (1/2). The probability of not getting a “1” on two consecutive throws is (1/4). That’s the probability of getting no “1” on two throws. We subtract this from one to get the probability of at least one “1”: P = (3/4), which greater than 1/5. Answer to the prompt = “no.” But, suppose N is larger. For easy of calculation, I will pick N = 15, even though 15 is not prime. If N = 15 produces a probability less than 1/5, then so will any prime number greater than 15. If N = 15, then the probability of not getting a “1” on a single throw is 14/15. The probability of not getting a “1” on two consecutive throws is this squared, 196/225. If this is more than 4/5, then subtracting it from one will be less than 1/5. Well, 225/5 = 45, and 45 times 4 is 180. Thus, (180/225) = (4/5), and (196/225) > (4/5). Subtracting this from one will produce a probability less than 1/5. Answer to the prompt = “yes.” This statement is consistent with different answers to the prompt question, so it does not lead to a definitive answer. This statement, alone and by itself, is not sufficient. Statement #2: We have already seen that N = 15, or any number larger than that, produces a “yes” answer to the prompt. Is it possible to produce a “no” answer to with a value of N greater than 5? I will use N = 7. The probability of not getting a “1” on a single throw is 6/7. The probability of not getting a “1” on two consecutive throws is this squared, 36/49. If this is less than 4/5, then subtracting it from one will be more than 1/5. Well, clearly, 36/45 = 4/5, and making the denominator larger makes a fraction smaller, so 4/5 = 36/45 > 36/49. So, this fraction is less than 4/5, so subtracting it from one will result in a probability that is greater than 1/5. This gives a “no” answer to the prompt. This statement is consistent with different answers to the prompt question, so it does not lead to a definitive answer. This statement, alone and by itself, is not sufficient. Combined statements: As we saw in the previous statements, the prime number N = 7 gives a “no” answer, and the non-prime N = 15 gives a “yes” answer, which implies that any prime number greater than 15 (such as 17, 19, 23, etc.) would also give a “yes” answer. Different answers are possible even with the constraints of both statements. Together, both statements are still not sufficient. Answer = (E) 5. This is a tricky problem, because there are several constraints in the problem. first of all, the number of members is N, so the numbers in the set go from 5 to 5N. The integer K has the quality that 5N < K < (5N + 5), because K is bigger than the biggest member of the set, but 5N has to be the largest multiple of 5 less than K. We know that the mean of the set is not divisible by 5, and this is important. For an evenly spaced set, the mean & median are identical. If there were an odd number of members, the mean & median would simply be the middle number on the list, and this of course would be some multiple of 5. The fact that mean & median is not divisible by 5 necessarily means that there must be an even number of members on the list. This way, the mean & median would be the average of the middle two numbers, which would be a non-integer, certainly not an integer divisible by 5. Therefore, N is an even number. Finally, we are also told that N itself is not divisible by 5—an odd constraint that may be relevant. Statement #1: Here, N could be any even number less than 52, as long as it’s not divisible by 5. It could be {48, 46, 44, 42, 38, ….} Multiple possibilities. This statement, alone and by itself, is not sufficient. Statement #2: The statement tells us that K > 5*48, so it could be that N = 48, so that K would be between 5(48) and 5*(49). That’s a possibility, or N could be any larger even number that is not divisible by 5. N could be {48, 52, 54, 56, 68, 62, …} Again, multiple possibilities. This statement, alone and by itself, is not sufficient. Combined statements: with both constraints, the only possible value if N = 48. The statements together are sufficient. Answer = (C) 6. This is a tricky one. Statement #1: two kinds of numbers have exactly four factors: (a) products of two distinct prime numbers, and (b) cubes of prime numbers. The product of two distinct prime numbers S and T would have factors {1, S, T, ST}. For example, the factors of 10 are (1, 2, 5, 10), and the factors of 21 are {1, 3, 7, 21}. The cube of a prime number S would have as factors 1, S, S squared, and S cubed. For example, 8 has factors {1, 2, 4, 8} and 27 has factors {1, 3, 9, 27}. We know N is not a power of D, so the second case is excluded. N must be the product of two distinct prime numbers. We know D < N, so of the four factors, D can’t be the product of the two prime numbers. D could be either of the prime number factors, or D could be 1, which is not a prime number. Because D could either be a prime number or 1, we cannot give a definitive answer to the question. This statement, alone and by itself, is not sufficient. Statement #2: this is tricky. The first few plug-ins seem to reveal a pattern.  Even if you sense a pattern, it’s important to remember that plugging in numbers alone is never enough to establish that a DS statement is sufficient. Here, if we persevered to one more plug-in, we would find the one that breaks the pattern.  That gives another answer to the prompt, so we know this statement is not sufficient. To avoid a lot of plugging in, it’s also very good to know that in mathematics, prime numbers are notorious for not following any easy pattern. It is impossible to produce an algebraic formula that will always produce prime numbers. In fact, this is more than you need to know, but the hardest unsolved question in higher mathematics, the Riemann Hypothesis, concerns the pattern of prime numbers; mathematicians have been working on this since 1859, and no one has proven it yet. Suffice to say that no one-line algebraic formula is going to unlock the mystery of prime numbers! Combined statements: according to the information in statement #1, either D = 1 or D is a prime number. Well, statement #2 excludes the possibility that D = 1, because that number cannot be written as two more than a power of 3. Therefore, D must be a prime number. We have a definitive answer to the prompt question. Combined, the statements are sufficient. Answer = (C) DS Probability Questions 1. A class contains boys and girls. What is the probability of selecting a boy from a class? Statement #1: there are 35 students in the class Statement #2: the ratio of boys to girls is 3:4 2. Bert has $1.37 of loose change in his pocket —- pennies ($0.01), nickels ($0.05), dimes ($0.10), and quarters ($0.25). He reaches into his pocket and pulls out one coin at random. What is the probability that the coin is a nickel? Statement #1: There are exactly seven pennies in his pocket Statement #2: There are exactly three quarters in his pocket Answers: 1. Statement #1: from this, we know there are 15 employees selected. We don’t know the value of M, which is clearly greater than or equal to 15. If M is very large, it may be highly unlikely that either Andrew or Georgia is seated. If M is closer to 15, then that would change the probability. Without knowing the value of M, we can’t complete the calculation. This statement, alone and by itself, is insufficient. Statement #2: Ignore the information in the first statement. If M = N, then all employees, everyone in the pool of selection, takes a seat. It is simply a matter of seating a group of M employees randomly in M seats. Think about this. For every seating arrangement with Andrew to the right of Georgia, there will be exactly one seating arrangement, the mirror image, that has Andrew to the left of Georgia. Since there’s a one-to-one correspondence between these two, there must be just as many arrangements with Andrew on one side of Georgia as on the other side. Both are equally likely, so the probability must be 1/2. This information was enough to calculate a numerical answer to the prompt question. This statement, alone and by itself, is sufficient. First not sufficient, second sufficient. Answer = B. 2. A reminder for non-American students — $1.00 = 100¢. Thus penny = $0.01 = 1¢ nickel = $0.05 = 5¢ dime = $0.10 = 10¢ quarter = $0.25 = 25¢ Statement #1: Bert has seven pennies, amounting to 7¢. The other coins total $1.30. This could be all nickels — 26 nickels — so that of the 7 + 26 = 33 coins in the pocket, 26 are nickel, and the probability of picking a nickel would be 26/33. Or, that $1.30 could be 4 quarters and 3 dimes, so that there were no nickels, and the probability of picking a nickel would be zero! Different possible choices lead to different answer to the prompt question, so this statement, alone and by itself, is insufficient. Statement #2: Bert has three quarters, amounting to 75¢. The other coins total 62¢ — this could be two pennies and twelve nickels, that of the 3 + 2 + 12 = 17 coins in the pocket, 12 are nickels, and the probability is 12/17. Or, that 62¢ could be entirely in pennies, without any nickels or dimes at all: then the probability of picking a nickel would be zero. Different possible choices lead to different answer to the prompt question, so this statement, alone and by itself, is insufficient. Combined statements: Now, we know Bert has seven pennies and three quarters, and these ten coins together account for 82¢. The remaining 55¢ must be composed of dimes and nickels. There could be eleven nickels and no dimes, so that of the 10 + 11 = 21 coins in the pocket, 11 are nickels, and P = 11/21. OR, there could be five dimes and one nickel in the pocket, so of the 10 + 5 + 1 = 16 coins in the pocket, only one is a nickel, and P = 1/16. Different possible choices lead to different answer to the prompt question, so both statements combined are insufficient. Nothing is sufficient. Answer = E Try This Tricky Data Sufficiency Question! On each lab that René completed he received either 100 points or 85 points. On how many labs did he score 100 points?
(2) René completed a total of twelve labs. (B) Statement (2) ALONE is sufficient, but statement (1) alone is not sufficient. (C) BOTH statements TOGETHER are sufficient, but NEITHER statement ALONE is sufficient. (D) EACH statement ALONE is sufficient. (E) Statements (1) and (2) TOGETHER are NOT sufficient The post GMAT Sample Data Sufficiency Practice Questions appeared first on Magoosh Blog — GMAT® Exam. |
| FROM Magoosh Blog: The Data Insights Calculator |
 On the GMAT Quantitative section, there is no calculator. On the Data Insights section, there is a built-in calculator. The calculator that comes with GMAT’s official DI practice questions is quite similar, almost identical, to what you will see in the test. Here is a brief tour of that calculator. The Calculator  First of all, there are ten digit buttons, four buttons for the four fundamental arithmetic operators (add, subtract, multiply, divide), a plus-or-minus button, decimal, and an equal sign. I am assuming that these are self-explanatory, as they appear in virtually all calculators. BTW, the display in this picture is the Golden Ratio, Mike’s favorite number. The Right Column Those buttons are probably self-explanatory, but I’ll go through them just for clarity. The top button, the √ button, takes the positive square-root of whatever number is currently on the display. If you type 169 and then hit the √ button, a 13 will appear on your screen, because 13 is the square-root of 169. The second button down, the % button, is a bit unintuitive and, arguably, inane. Suppose you something originally costs $130, and then increases by 15%: what is the final price? In the calculator, you would type: 130 + 15% And that will produce the correct answer: $149.50. Of course, I would far prefer, rather than relying on this button, that you learn how to perform percentage increases and decreases using multipliers. Using that method, in order to create a 15% increase, we would multiply the multiplier 1.15 by the original number (130). The third button in that column, the 1/x button, simply take the reciprocal of whatever number is on the screen. If we you have 20 on the screen and hit the 1/x button, you will get 0.05, which is the decimal equivalent of 1/20. The Memory Buttons On the left side, there are four buttons of the form M-something. These are the memory buttons (the “M” is for memory). These buttons can be extraordinarily helpful in a complicated, multi-step calculation. They allow to store and later access one number, while you are calculating something else. The third button down, MS, memory store, stores whatever is currently the visible entry on the calculator into the memory. If something else was previously in the memory, the calculator erases that previous memory and stores the current entry in its place. The fourth button, M+, memory addition, adds the current entry to whatever it currently stored in memory, and what is now in memory as the result of hitting that button is the sum (notice: the original number has been erased; only the sum is in memory). Thus, if I type 17 then hit MS, storing 17 to memory, then clear the entry, type 24, then M+, what is now in memory is 41 (the sum of 17 and 24). This button can be very useful if you are adding up a list and each entry on the list involves a multi-step calculation. If the memory is empty, hitting this button is equivalent to hitting the MS button. The second button, MR, memory recall, “recalls” the memory, that is to say: whatever the current value stored in memory is displayed as the entry on the screen. This button is how you “get” whatever is stored in memory, in order to use that number in a further calculation. The top button of this sequence, MC, memory clear, clears whatever is in memory. It erases the current value in memory resets the memory to empty. I highly recommend, if you use the memory buttons at all, hit this button at the beginning of each new problem. The last thing you want is to have some number stored from Problem 4, and then in the course of, say, Problem 6, accidentally hit M+, thereby adding unrelated numbers from two different problems! The Top Row This could be the most confusing set, if you are seeing these for the first time. These three buttons all have to do with managing the information displayed on the screen. First of all, here are the abbreviations: BS = backspace. CE = clear entry. CA = clear all. (On the real GMAT, the “BS” button actually said the word “backspace”, not just the abbreviation “BS.”) Now, exactly what do these do? The backspace button is very much like the backspace on a full keyboard. If you type 147 and then realize you mean 137, you could hit BS twice, to erase the two right-most digits, and then type the 3 and the 7 you intended. Before I explain the different between CE and CA, it’s important to understand how this calculator thinks. Suppose I want to calculate 1957*135 Of course, I first type 1957, then press the multiply button. Once I have hit that button, the calculator is primed to receive the next factor. As soon as I start typing 135, the 1957 disappears, and the 135 appears. Then, ideally, you would hit the = button to find the answer: 264,195. Now, suppose in that process, you type 1957 correctly, hit the multiplication button, and then start typing, but you realize it’s wrong: either you miscopied the number, or perhaps you misread the question and realize you actually should be multiplying a completely different number. You can use the BS button to make a small adjustment, but if you just want to get rid of entire second factor and start that part from scratch, you could hit CE, clear entry. The clears the current entry, but keeps the underlying process (1957 times something) intact. That’s very useful if you are in the midst of a long calculation and just want to make a change to the current entry. By contrast, if you want to clear everything, not only the visible entry but any processes about which the calculator may be thinking, use CA, clear all. That not only restores the entry to clear, but also guarantees that the calculator is not thinking about something else. If you started to type 1957 times something, but then did only CE and started to do something else, the visible entry on the calculator would be zero, but the calculator would still be “waiting” to multiply 1957 times whatever the next entry is. If you forget this, you would be very confused the next time you enter something, and the calculator gleefully multiplies it by 1957. I highly recommend: every time you are done, every time you want to make a fresh start, hit the CA button. There’s never a problem with hitting the CA too many times, and it’s an excellent way to guarantee that the entry is restored to its pristine start state, with no hidden calculations looming in the calculator. Order of Operations This calculator does not understand order of operations, PEMDAS. First of all, it has absolutely no parenthesis or exponents. Second, suppose we want: (1350)*(8) + (1050)*(18) On an ordinary calculator, I could just type in that order, and the calculator would understand. This DI calculator does not do order of operations: rather, it just calculates uninterrupted from left to right. Thus, I type 1350, then multiply, then 8, then +, and sure enough, I get the product of the first two terms, 10800. Now, here’s where the trouble starts — next I type 1050, and when I hit the next operator, multiply, the calculator simply adds 1050 to 10800, to get 11850. In other words, it just does each next operation, reading from left to right, in total disregard of the order of operations. So, given that, if we had to calculate (1350)*(8) + (1050)*(18), what would you do? I would calculator (1350)*(8) = 10800, then hit MS, storing this to memory. I then would hit CA, to restore the screen. Then I would type (1050)*(18) = 18900, then hit M+. Then I would hit CA, then MR, which would call up my answer: 29700. Final Tip for the Data Insights Calculator I hope you found this tour of the calculator helpful, but ironically, my most important tip is: make it your goal to use the calculator as little as possible. Use mental math and estimation to breeze through question rather than waste time using the calculator. The post The Data Insights Calculator appeared first on Magoosh Blog — GMAT® Exam. |
| FROM Magoosh Blog: Data Insights Question Type: Bar Charts |
|
Fact: One common way data will displayed on GMAT Data Insights questions is in bar charts. This post is a whirlwind overview of what you need to know about the varieties of bar charts in order to be successful with them on the new DI section. Bars & Columns Some sources call a graph with horizontal bars a “bar chart” and a graph with vertical bars a “column chart.” Apparently, GMAC is not interested in that distinction, because the OG 13’s section on DI calls graphs with vertical bars “bar charts”; presumably, if the bars were horizontal, GMAC would still call them “bar charts.” A little more is at stake here than pure semantics. Typically, when the bars are horizontal, each bar represents a completely different item from some overarching category. For example:  Here, the bars are different fruits. Why these fruits were selected, and not others, is not obvious. The order here is simply alphabetical, as there is no pre-determined way to put fruits into “order”, whatever that would mean. If there is no inherent order to the categories, and the representative chosen do not exhaust the category, then the data typically would be displayed in horizontal bars, what many sources would call a “bar chart.” If the set has an inherent order to it (days of the weeks, months of the year, etc.) and/or the representative shown constitute all in the category, the data typically would be displayed in vertical bars, what many sources would call a “column chart”, but which GMAC appears to still call a “bar chart.” For example:  Here, days of the week have a well-defined order, in which they are displayed. Assuming this business only operates during weekdays, this is also a complete set of all the days on which they do business. That’s why the vertical columns are used. Segmented Bars & Columns This is a more detailed chart of the “sales by day of week” chart given above.  This one gives more nuanced information. Apparently, this company has two divisions, and how each division performs during different days of the week varies considerably. For example, Division 1 clearly has its best days on Wednesdays, while for Division 2, Mondays and Thursdays appear to be close to tied for best days. Here, the individual pieces are displayed as segments of a column because we might be interested in knowing either the revenues of either division separately or the total revenues of the company, which equals the sum of the revenues of the two divisions. Clustered Bars & Columns Sometimes we care about the sum of the parts, and sometimes we don’t. If, instead of being two divisions of the same company, those same data were interpreted as the revenues of two different companies competing in the same market, then the sum of the revenues would be virtually meaningless. In this case, the columns or bars are “clustered”, that is to say, displayed side-by-side. For example:  Here, the side-by-side comparison makes it very easy to compare which company outperforms the other on each day of the week. Practice GMAT Data Insights Questions: Graphics Interpretation The following graph shows the annual revenues of two companies, close competitors in the same market, over a recent six year period.  1) Company B’s revenues in 2005 were approximately A) $56,000 B) $85,000 C) $132,000 D) $154,000 E) $217,000 2) Of the years shown, in the first year that Company B’s revenues overtook Company A’s revenues, how much more money did Company B earn that year? A) $45,000 B) $63,000 C) $91,000 D) $108,000 E) $138,000 3) What was the percentage decrease in Company A’s revenue from 2007 to 2008? A) 4.5% B) 11.4% C) 26.2% D) 32.2% E) 55.7% 4) Suppose for each year shown, we calculate the ratio of Company B’s revenues to Company A’s revenues. From 2003 to 2008, by what percent did this ratio increase? A) 16.7% B) 109.5% C) 219.1% D) 441.7% E) 1104.4% Practice Question Explanations 1) This first question is a very straightforward question about reading a single value from the chart. We want Company B’s profits in 2005. We look at the red column above 2005, which has a height slightly above $80K, certainly less than $90K, about halfway between them. The only answer in that ballpark is $85000, answer = B. 2) This is a slightly trickier question. First, we need to identify the first year in which Company B’s revenues overtook Company A’s revenues. This would be the first year on the chart for which the red column is higher than the blue column. The first time this happens is 2007. In 2007, A made something just above $90K, say $93K, and B made something just below $140K, say $138K. We want to know how much more Company B earned, so we subtract: $138K – $93K = $45K, and this is answer A. 3) In 2007, A made something just above $90K, say $93K. In 2008, A made something just above $960K, say $63K. For approximation purposes, let’s just round these to $90K and $60K respectively. If the revenues went from $90K in 2007 to $60K in 2008, that’s a drop of $30K, which is one-third of the starting value $90K. One-third as a percent is 33.3%, so the percentage decrease is going to be something very close to 33.3% percent. The only close answer choice is 32.2%, answer = D. 4) This is a very challenging question, about as hard as anything the GMAT is going to ask on the DI section. Notice that the answer choices are very widely spaced, which means we have free rein to approximate in answering this question. First, we have to approximate the two values of the ratio. In 2003, A earns approximately $130K, and B earns just over $20K. I’m going to approximate B’s earnings as $26K, so that both the numerator and denominator are divisible by 13. Then the ratio becomes: ratio B:A in 2003 = 26/130 = (2*13)/(10*13) = 2/10 = 0.2 Then, in 2008, A earns just over $60K, and B earns something over $150K, so I am going to approximate them as $60K and $150K respectively. Then: ratio B:A in 2008 = 150/60 = (5*30)/(2*30) = 5/2 = 2.5 According to our approximation, the ratio has increase by a factor of factor = 2.5/0.2 = 25/2 = 12.5 times Now, a tricky thing about percent increase. If I multiply by 2 (x becomes 2x), that’s a 100% increase. If I multiply by 3 (x becomes 3x), that’s an increase of 2x, a 200% increase. If I multiply by 4 (x becomes 4x), that’s an increase 3x, a 300% increase. Here, we multiply by 12.5 — x becomes 12.5 x — so that’s an increase of 11.5, a 1150% increase. The only answer even vaguely close is E. The post Data Insights Question Type: Bar Charts appeared first on Magoosh Blog — GMAT® Exam. |
| FROM Magoosh Blog: Comparing Ratios on the GMAT |
 Among other things, this post is a case study of an OG DS question: OG 12th Edition, Data Sufficiency Practice Problem #23 Here is the problem that appears in the OG: 23) If p1 and p2 are the populations and r1 and r2 the number of representatives of District 1 and District 2 respectively, the ratio of the population to the number of representatives is greater for which of the following districts? (1) p1>p2 (2) r2>r1
Below, I’ll show the solution to this. Basic Fraction Facts Here are two very important fraction rules. 1) When the numerator increases and the denominator stays the same, the fraction as a whole increases. When the numerator decreases and the denominator stays the same, the fraction as a whole decreases. 2) When the denominator increases and the numerator stays the same, the fraction as a whole decreases. When the denominator decreases and the numerator stays the same, the fraction as a whole increases. Those, as they are stated, are always true 100% of the time. Not As Simple If both the numerator and denominator change at the same time, then things are trickier. See the table below, which assumes that both numerator and denominator are positive. Numerator Denominator Fraction as a Whole increases increases (all bets are off) increases decreases increases decreases increases decreases decreases decreases (all bets are off) In the first case, for example, whether the fraction increases depends on how much the numerator increases, and how much the denominator increases. For example: 1/3 -> 2/5 both numerator & denominator increase, and fraction increases 1/3 -> 2/7 both numerator & denominator increase, and fraction decreases (Both of those can be easily seen from the fact that 1/3 = 2/6, so be increasing or decreasing the denominator of 2/6, we can create bigger or smaller fractions.) Back to the OG DS Problems Now, we can tackle the DS problem above. We are comparing fractions of population over number of representative, p/r. Statement #1: The numerator of the first fraction is larger. If we knew the denominators were staying the same or getting smaller, we could deduce that the fraction overall is getting bigger. Unfortunately, we have no information about how the denominators compare. Statement #1, by itself is insufficient. Statement #2: As always in GMAT DS question, we have to forget about everything in Statement #1 and focus only on what Statement #2 says. — We know the second fraction has a lager denominator. We have no information now about the numerators. Statement #2, by itself is insufficient. Statements #1 & #2 combined: Now, we know that when we go from the first fraction to the second fraction,  the numerator decreases and the denominator increases. This is row three of the table above: the fraction as a whole decrease, so District #2 has a lower population to representative ration than District 1. Answer = C Here’s another GMAT Data Sufficiency Question on ratios, to practice: http://gmat.magoosh.com/questions/995 The post Comparing Ratios on the GMAT appeared first on Magoosh Blog — GMAT® Exam. |

|
|
||
|
Hi Generic [Bot],
Here are updates for you:
ANNOUNCEMENTS
Tuck at Dartmouth
AGSM at UNIVERSITY OF CALIFORNIA RIVERSIDE
 Free Resources
|